File:SinCosPlot2.png
From Sutherland_wiki
Error creating thumbnail: Unable to save thumbnail to destination
No higher resolution available.
SinCosPlot2.png (552 × 414 pixels, file size: 6 KB, MIME type: image/png)
x = linspace(-pi,pi);
f1 = cos(x);
f2 = sin(x);
plot(x,f1, x, f2);
xlabel('x'); ylabel('f(x)');
legend('cos(x)','sin(x)');
File history
Click on a date/time to view the file as it appeared at that time.
| Date/Time | Thumbnail | Dimensions | User | Comment | |
|---|---|---|---|---|---|
| current | 17:19, 23 August 2008 | 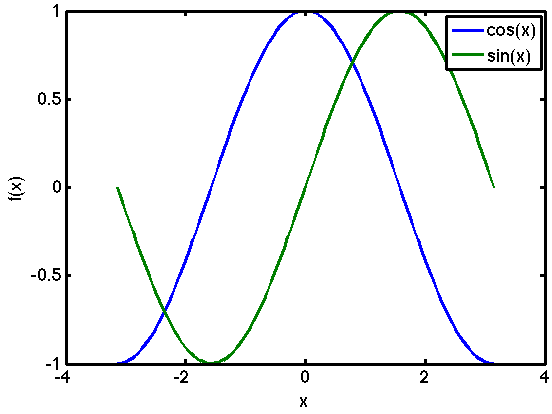 | 552 × 414 (6 KB) | 00033394 (talk | contribs) | <source lang="matlab"> x = linspace(-pi,pi); f1 = cos(x); f2 = sin(x); plot(x,f1, x, f2); xlabel('x'); ylabel('f(x)'); legend('cos(x)','sin(x)'); </source> |
- You cannot overwrite this file.
File usage
The following page links to this file: